Analysing Air Quality Data with R
View the full code in my Github profile.
DATASET SOURCE
UCI Machine Learning Repository.
It comprises 9358 observations of 10 sensor responses, aimed at measuring 6 different pollutants.
OVERVIEW
The primary focus is on tropospheric ozone, also known as ground-level ozone. Ozone, in general, plays a dual role in the atmosphere. Stratospheric ozone protects life on Earth by absorbing harmful UV radiation, while tropospheric ozone (the central subject of this work) is a pollutant formed through chemical reactions in the lower atmosphere, associated with air quality concerns and potential health issues.
DATA CLEANING AND PREPROCESSING
(1) Perform data reformatting to ensure numeric consistency.
(2) Adjustments to the Date and Time variables to make them compatible with R.
(3) Create two categorical features, "Day" and "Season".
EXPLORATORY DATA ANALYSIS
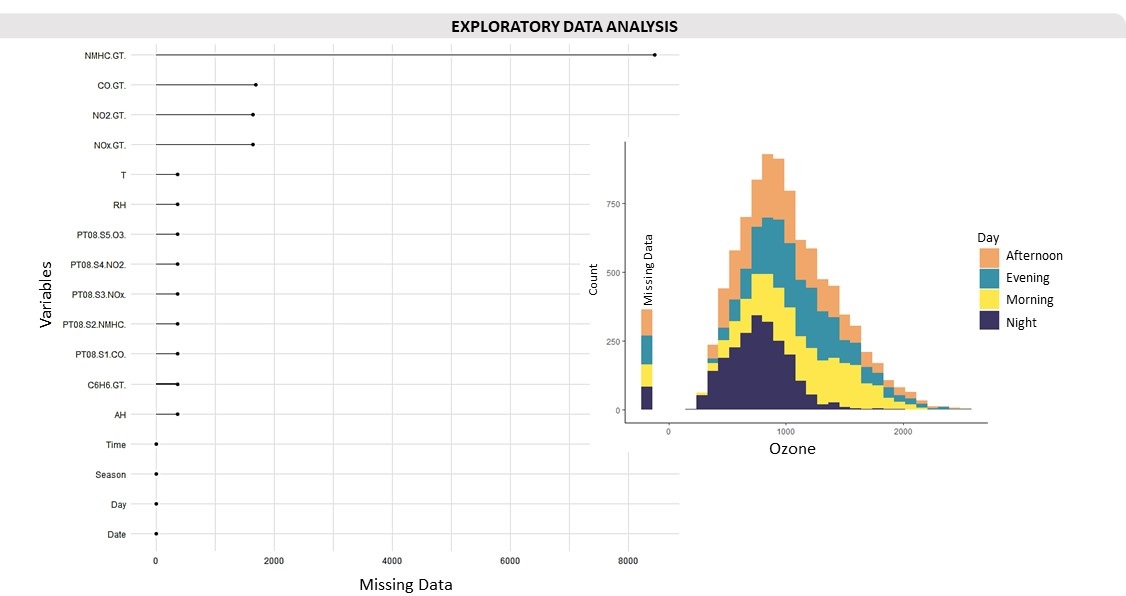
Upon exploring the dataset, the contamination gas levels were shown lower during the night (except for Nitrogen oxides), while not significant variations were detected across different seasons. The data also confirmed the presence of missing data in all variables, which were marked with the value -200, as specified in the UCI Repository. These missing values will need to be addressed in our data analysis and modelling.
MISSING DATA
A total of 16701 missing data points were identified in the dataset, marked with the value -200, with the Non-Methane Hydrocarbons (NMHC) variable had the highest number of missing entries. To address these gaps, the missing data was imputed by replacing them with the corresponding day's average value. This imputation strategy allows to maintain data consistency and continue our analysis while accounting for the missing information.
CORRELATION
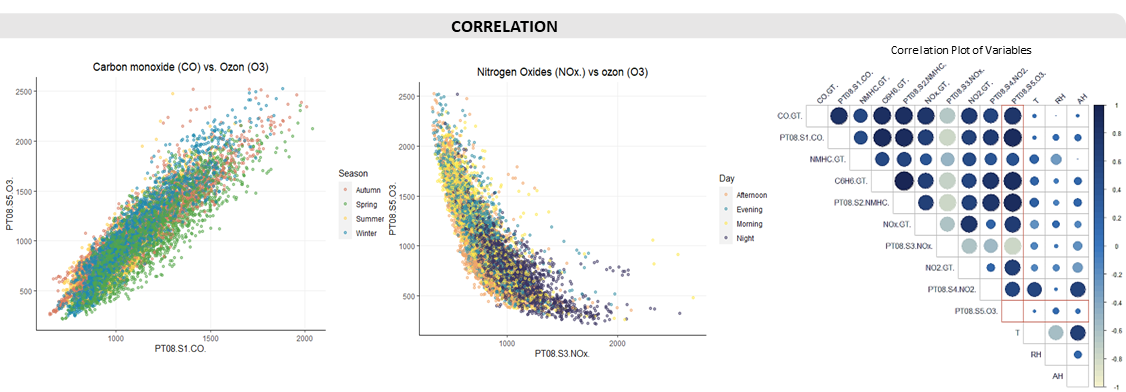
Analysis of correlations was conducted, revealing significant insights into the factors influencing ozone levels. The findings indicate that ozone exhibits strong positive correlations with most gases, suggesting their potential contributions to ozone formation.
However, there is a negative correlation with Nitrogen Oxides (NOx), a relationship influenced by various complex factors. While nitrogen oxides plays a role in the formation of ground-level ozone (O3), the interaction between NOx and ozone is complicated, and is not a straightforward one-to-one relationship.
Understanding the nuanced dynamics between these atmospheric variables requires a detailed examination of the specific context and data sources, as various factors can influence their interactions.
BUILDING THE MODEL
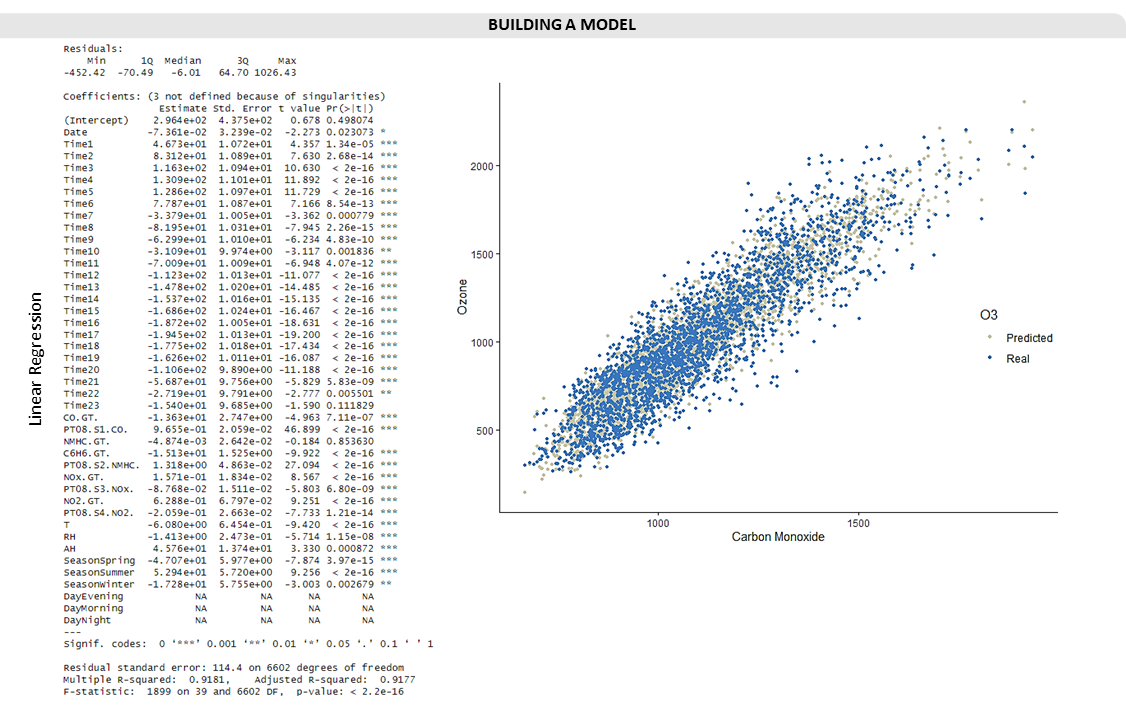
Given the characteristics of the dataset, a Linear Regression model opted to employ. The approach involved the data partitioning into training and test sets, applying cross-validation techniques, and fine-tuning the machine learning parameters for optimisation.
The results of the model are promising, with an R-squared value of 0.9181, indicating a strong fit of the model to the data. Furthermore, when examining the visual plot of predicted values against actual values, a good fit was observed, particularly in the lower ranges of carbon monoxide levels.


